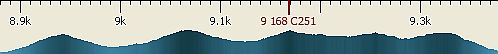
The Ruler shows the coordinates in the Reads Area. When you move the mouse cursor in the Reads Area the coordinate of the selected location with the coverage of reads is shown on the ruler in dark red. The Coverage Graph shows the exact coverage of the sequence at each position. For example on the image below the coordinate is 9168 and the coverage of reads is 251.
To show/hide the coordinates on the ruler you can click the following button on the toolbar:

To show/hide the coverage on the ruler you can click the following button on the toolbar:

Alternatively, you can use the Show coordinates and Show coverage under cursor check boxes located on the Assembly Browser Settings tab of the Options Panel.