To change settings of a graph, select the Graph->Graph settings item in the graph context menu. The Graph Settings dialog appears:
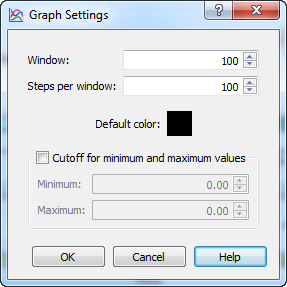
The following parameters are available:
Window — the number of bases in a window.
Steps per window — the number of steps in window. The Step is calculated as Window / Steps per window.
Default color — the default color of line of graph (or lines of graphs for GC Frame Plot).
Checking of the Cutoff for minimum and maximum values checkbox enables the following settings:
Minimum — the minimum value for cutoff.
Maximum — the maximum value for cutoff.
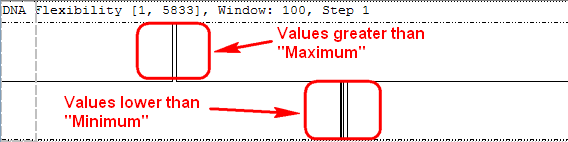
Select an appropriate minimum and maximum value and click the OK button to show the graph of cutoffs. The graph is divided into 2 parts. The upper part shows values greater than the specified Maximum value. The lower part of the graph shows values lower than the specified Minimum value. For example: