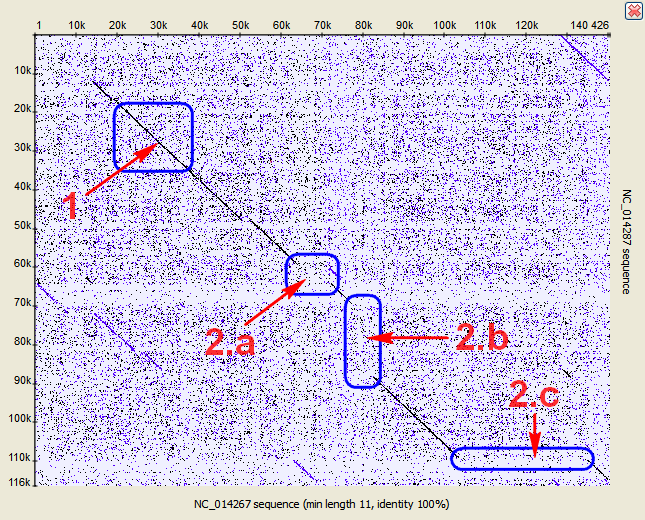
Using a dotplot graphic, you can identify such the following differences between the sequences:
1. Matches
A match between sequences looks like a diagonal line on the dotplot graphic, representing the continuous match (or repeat).
2. Frame shifts
a. Mutations
Mutations are distinctions between sequences. On the graphic they are represented by gaps in diagonal lines. They interrupt matches.
b. Insertions
Insertions are parts of one sequence that are missed in the another, while the surrounding parts match. In other words, an insertion is a subsequence that was inserted into a sequence.
Graphically, insertions are represented by gaps which lie only on one axis. A little shift towards the other axis indicates a mutation involved.
c. Deletions
A deletion is a subsequence that was deleted from a sequence.
A deletion from sequence A found in sequence B can be considered as an insertion into sequence B and contained in sequence A.
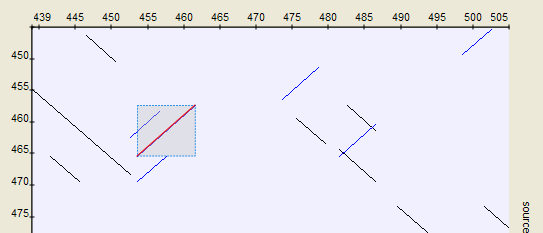
3. Inverted repeats
The Dotplot plugin allows to search for inverted repeats as well. Inverted repeats are shown contrary to the direct repeats.
Use the Search direct repeats and Search inverted repeats options of the Dotplot parameters dialog to select which repeats to draw (the dialog is described here).
4. Low-complexity regions
A low-complexity region is a region produced by redundancy in a particular part of the sequence. It is represented on a plot as a rectangular area filled with the matches.
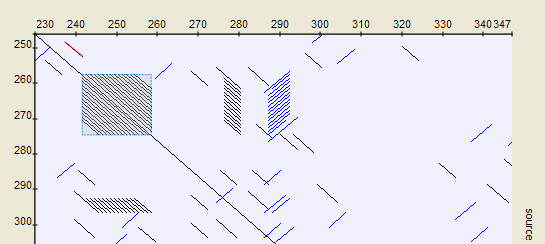
Hint
Compare sequence with itself to easily find low-complexity regions in it.