The DNA/RNA Graphs Package draws contextual graphs for sequences. The DNA/RNA Graphs Package is available for the Standard DNA and Standard RNA alphabets.
Open a sequence in the Sequence View and click the Graphs icon on the toolbar. The popup menu appears:
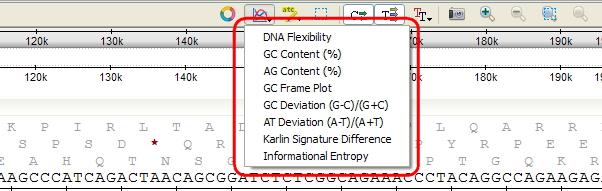
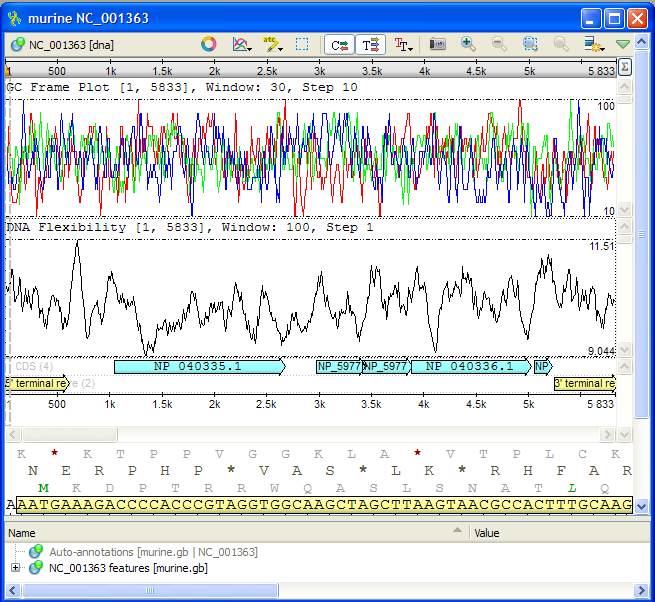
To see a graph select the corresponding graph item in the popup menu. A new area with the graph appears right above the Sequence zoom view:
Each point on a graph is calculated for a window of a specified size. The window is moved along the sequence by a step. See Graph Settings for instructions on how to modify these parameters.
It is possible to get information about each point of a graph. When a mouse is moved in the Graphs area, a small circle shows on the graph. A coordinates hint shows above it. When you hold Shift and click on a graph, the circle and the hint locks:
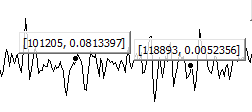
To remove it click on the hint. Also you can delete all labels by Graph->Delete all labels context menu. To select all extremum points use the Graph->Select all extremum points context menu item.
All graphs are always aligned to the range shown in the Sequence zoom view. It means that if you change the visible range in the overview (either by zooming or scrolling) the graph will also be updated. The minimum and maximum values of the visible range are shown at the right lower and upper corners of the graph.
To close a graph, uncheck its item in the popup menu.