The tool was added in version 50.
The 'mfold' software is a tool for nucleic acid folding and hybridization prediction. It was developed by M. Zuker in the late 1980s for RNA folding and improved for DNA folding in 1996. mfold uses nearest neighbor energy rules.
Tool home page: mfold.org. Similar results to those produced by UGENE can be obtained using the mfold web server (DNA prediction, RNA prediction) or using the OligoAnalyzer tool. For complete documentation on the tool, see a) the website, b) the article, c) the source code in the corresponding folder.
UGENE uses Ghostscript to convert PS files to PNG and PDF.
ToC
Prerequisites
For mfold to work correctly, the path to the temporary directory must not contain spaces, non-printable characters and non-ASCII characters (Unicode characters such as emoji, Cyrillic, Chinese family of scripts, etc.). In this case, you need to change the path to the temporary directory in the appropriate setting.
UGENE itself must be installed to a path that does not contain non-printable characters or non-ASCII characters (Unicode characters). If installed incorrectly, a corresponding error while running the mfold task will be displayed.
Open the dialog
mfold only works with DNA or RNA sequences. You can trigger the dialog form
by selecting the appropriate Sequence View Global action 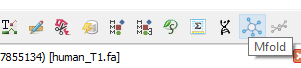
or through the Main Menu→Actions→Analyze 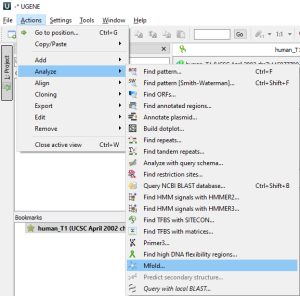
or through the Sequence Context Menu→Analyze 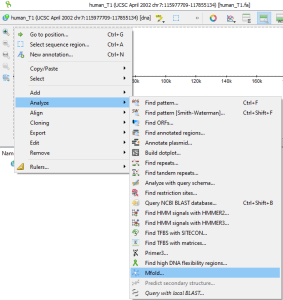
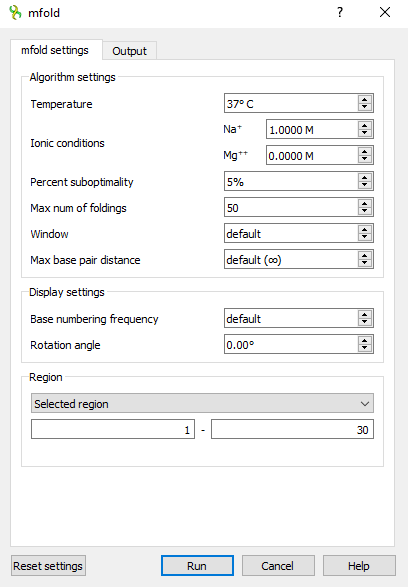
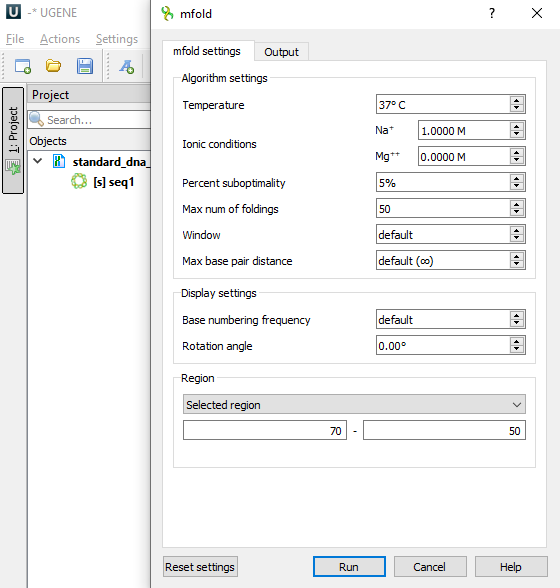
This is what the mfold dialog looks like on Windows OS
Input parameters
The tool is passed explicit and implicit parameters. Explicit parameters are set in the dialog, implicit parameters are taken from the sequence context.
Algorithm settings
For complete settings details, see the documentation on the mfold website or documentation in source.
This is the Settings section of the mfold settings tab.
| Parameter | Unit | Default | Limits | Tool argument name | Description |
|---|---|---|---|---|---|
| Temperature | °C | 37 | [0,100] | T | The folding temperature. For RNA this is always the default value. For DNA it is taken from the dialog. |
| Ionic conditions | M | Na=1 | [0,1.5] | NA_CONC | Ionic conditions are used to enter total monovalent (Na) and divalent (Mg) ions concentrations. For RNA this is always the default values. For DNA it is taken from the dialog. |
| Mg=0 | MG_CONC | ||||
| Percent suboptimality | % | 5 | [1,100] | P | The suboptimality percentage controls the free energy increment δδG for computing suboptimal foldings. Only foldings with a free energy ≤ΔG+δδG will be computed, where ΔG is the predicted minimum free energy. Normally, δδG=(P/100)|ΔG|, but it is rounded up to 1 kcal/mol or down to 12 kcal/mol if it is outside this range. |
| Max num of foldings | 50 | [1,100] | MAX | This is the maximum number of foldings that mfold will compute. It is better to limit the number of foldings by careful selection of the P and W parameters. | |
| Window | 0 (len≤29) 1 (30≤len≤49) 2 (50≤len≤119) 3 (120≤len≤199) 5 (200≤len≤299) 7 (300≤len≤399) 8 (400≤len≤499) 10 (500≤len≤599) 11 (600≤len≤699) 12 (700≤len≤799) 15 (800≤len≤1199) 20 (1200≤len≤1999) 25 (2000≤len) | [0,50] | W | The window parameter, W, controls the number of foldings that are computed. It may be thought of as a distance parameter. The distance between 2 base pairs, ri rj and ri' rj' may be defined as max{|i-i′|, |j-j′|}. If k-1 foldings have already been predicted by mfold, the kth folding must have at least W base pairs that are at least a distance W from any of the base pairs in the first k-1 foldings. A new folding is not added to the output list unless this criterion is fulfilled. As W increases, the number of predicted foldings decreases. A smaller value of this parameter will usually result in more computed foldings that may be quite similar to one another. A larger value will result in fewer foldings that are very different from one another. If the parameter is set to the default value, then in the calculations the real value of W will be set according to the described algorithm, based on the length of the selected region of the input sequence (see the Default column). | |
| Max base pair distance | ∞ | [1,∞] | MAXBP | If the maximum distance between paired bases parameter, MAXBP, is specified, then any base pair, ri rj, in a folding must satisfy Thus small values of MAXBP ensure that only short range base pairs will be predicted. For example, in a sequence of 1000 nucleotides, setting MAXBP to 50 will force mfold to compute foldings involving only short range base pairs. The default is MAXBP=∞, which means no constraint. |
Display settings
Corresponds to the Extended settings section on the main tab.
| Parameter | Unit | Default | Limits | Tool argument name | Description |
|---|---|---|---|---|---|
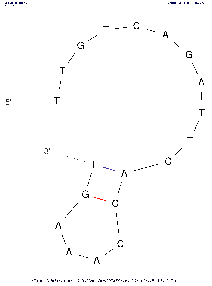
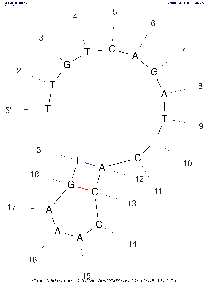
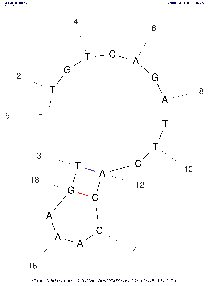
| Base numbering frequency | 10 (len≤50) 20 (51≤len≤300) 50 (301≤len) | [0,1000] | LAB_FR | Each image marks the number of the base (nucleotide) starting from the beginning 5'. The frequency with which this number will be displayed on an image depends on this parameter: Compare images above with the same algorithm settings to see the difference. If the parameter is set to the default value, then in the calculations the real value of LAB_FR will be set according to the described algorithm, based on the length of the selected region of the input sequence (see the Default column). | |
| Rotation angle | ° | 0 | [-180,180] | ROT_ANG | Specifying the orientation of the folded molecule by selecting the rotation angle. Positive values correspond to counter-clockwise. |
Region settings
Specifies the part of the sequence that will be analyzed. The tool will only work with this piece of the sequence in isolation from the whole sequence.
You can select the entire sequence, a custom region, or a selected region if there was one. The region must be less than 3000 bases. It is acceptable to select a small region (<10bp), but there will almost certainly be no folding there.
If several regions have been selected in a sequence (using the GenBank format), then the dialog will only accept the first of them. The remaining selected regions are ignored. But there is an exception: if the sequence is marked circular and the region passing through the end/beginning is selected, then such a region is considered as a whole region and mfold will be launched on it as on an ordinary piece of the sequence (2 parts of the region – one that goes to end and another that starts from the beginning of the sequence – will be combined into one sequence and analyzed). This is the only case where the start of a region can be greater than the end:
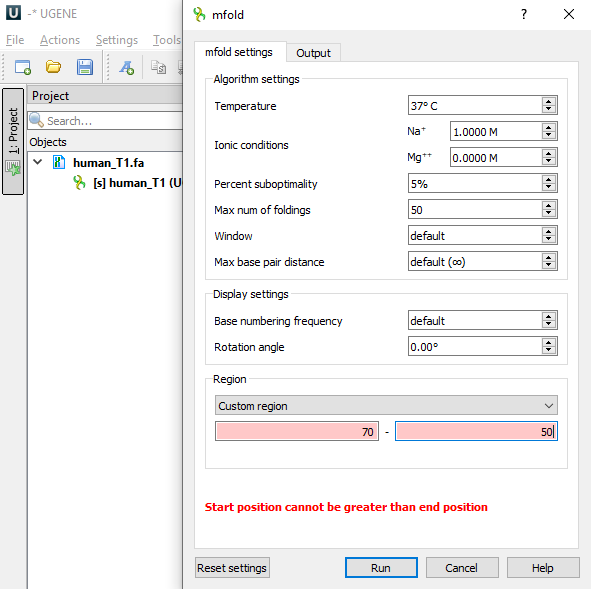
A linear sequence is marked with the symbol ![]() and for it the region 70..50 is invalid. A circular sequence is marked with the symbol
and for it the region 70..50 is invalid. A circular sequence is marked with the symbol ![]() and for it the region 70..50 is valid.
and for it the region 70..50 is valid.
The length of the region in this case 70..50 depends on the sequence length.
Output settings
UGENE&Ghostscript settings in the "Output" tab.
| Parameter | Default | Description |
|---|---|---|
| Save output to | /path/to/sequence/ | The folder where the "mfold" subdirectory will be created with the output data in it. By default, this folder is the same as the folder where the input sequence is stored. For example, let's say our OS is Windows and the analyzed sequence has the path "C:\path\to\sequence\my_sequence.fa". After running the task, the folder structure will look something like this C:.
└───path
└───to
└───sequence
│ my_sequence.fa
│
└───mfold
└───2024.03.19_16-31-34
inp.fa_1.pdf
inp.fa_1.png
inp.fa_2.pdf
inp.fa_2.png
inp.fa_3.pdf
inp.fa_3.png
out.html
|
| 96 | Setting up the Ghostscript converter from PS files to PNG. Quality of saved images (PNG files). The higher this parameter, the higher the quality, size and resolution of the resulting images. This setting only affects images in the output folder. This setting does not affect images in the UGENE report. This setting does not affect PDF output files. For more information about output types, see the Output data section. |
Internal parameters
Settings that the user cannot explicitly influence.
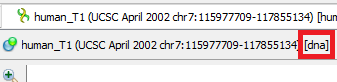
- Molecule Type (DNA/RNA). mfold gets sequence information from command line arguments. Information about what type will be passed to the tool can be seen next to the sequence name
- Molecule Topology (linear/circular). mfold gets sequence information from command line arguments. If the sequence is marked as circular, then mfold will work with it as a circular one. Otherwise, as with linear one.
Whether the sequence is linear/circular is described here.
Part of a circular sequence will also be considered a circular sequence. If you want to change this behavior, uncheck "Mark sequence as circular" and then call the mfold dialog.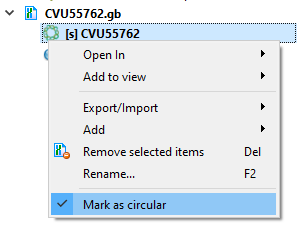
- DPI of images in UGENE. Ghostscript has a default DPI of 72. Therefore, this value is used for images for the internal UGENE report and this value cannot be changed.
Saving/resetting dialog state
Some dialog fields retain their state between dialog calls. For such fields, the ability to reset settings is also available (the "Reset settings" button at the bottom left in the screenshot of the dialog). Below is a table showing which states are saved between dialog calls and which of them can be reset to default values.
| Save states | Reset states | |
|---|---|---|
| Algorithm settings | yes (it can be tedious to enter fields every time) | yes |
| Display settings | ||
| Region | no (since the region is optionally selected manually by the user) | no (the same reason) |
| Output settings | yes | no (these unique settings are changed manually by the user when the user really needs it; a quick reset only makes sense for algorithmic settings) |
States are saved only for a specific sequence window. Thus, if you have two windows (or two views) for sequence-1 and one window for sequence-2, then each window will have its own state for the mfold dialog.
Output data
There are 3 types of output from the mfold task in UGENE:
- Report displayed inside UGENE.
- HTML report with images saved on disk.
- Temporary data (for advanced users).
UGENE report
Example of a report on Windows (appearance may vary slightly between systems):
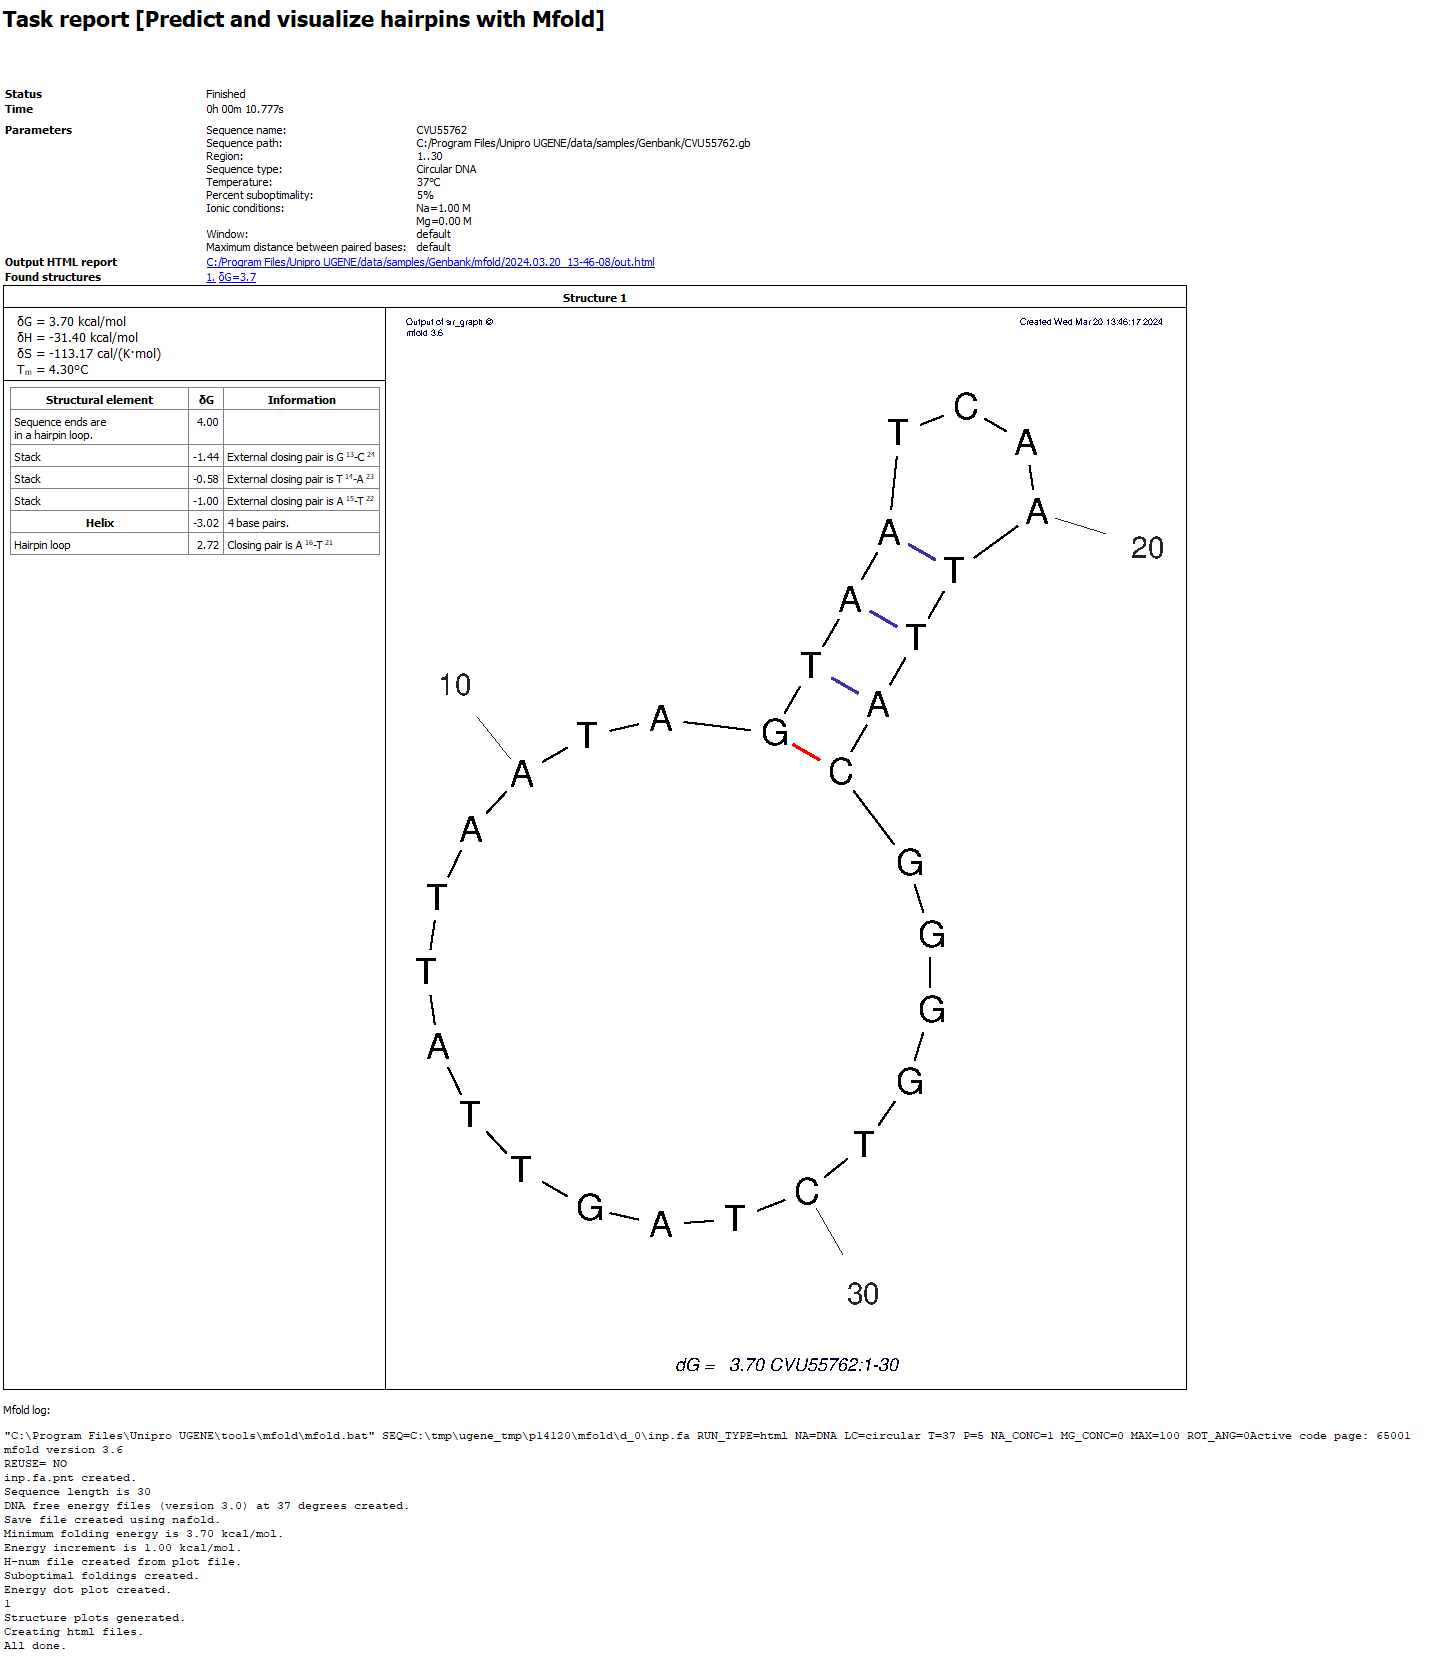
- Status, Time, … At the beginning there is information about the run: information about the task, settings for launch.
- Output HTML report. Clickable link to the output HTML report. More about this report in the next section.
- Found structures. List of found structures. The structure is characterized by free energy. When clicked, UGENE will scroll the window to the desired structure.
- Structure table. For each found structure, the table contains:
- Thermodynamic details: free energy, enthalpy, entropy and an estimated Tm.
- Loop Free-Energy Decomposition: the entire decomposition of the particular folding into loops and stacks, together with their free energies and closing base pairs. Consecutive runs of base pairs are summarized as helices.
- Image. Displays of nucleic acid secondary structure. At the bottom of the image there is information identifying it: free energy, name of the input sequence and analyzed region. It has the above-mentioned fixed DPI of 72.
- mfold log. Information about launching the external mfold tool: launch command and log.
If no structure is found, mfold will fail with an error and display a corresponding message "No hairpins found. Nothing to show". No new files will be created.
Sometimes the report may not contain the structure table. This happens because there are a lot of results/the resulting decomposition tables are too large. In this case, the result must be viewed in a browser (click on the "Output HTML report" link).
HTML report
A single HTML report and PNG+PDF for each structure found are saved in the output folder. The HTML report displays these images, PDFs and detailed information about the launch in an easy-to-view form.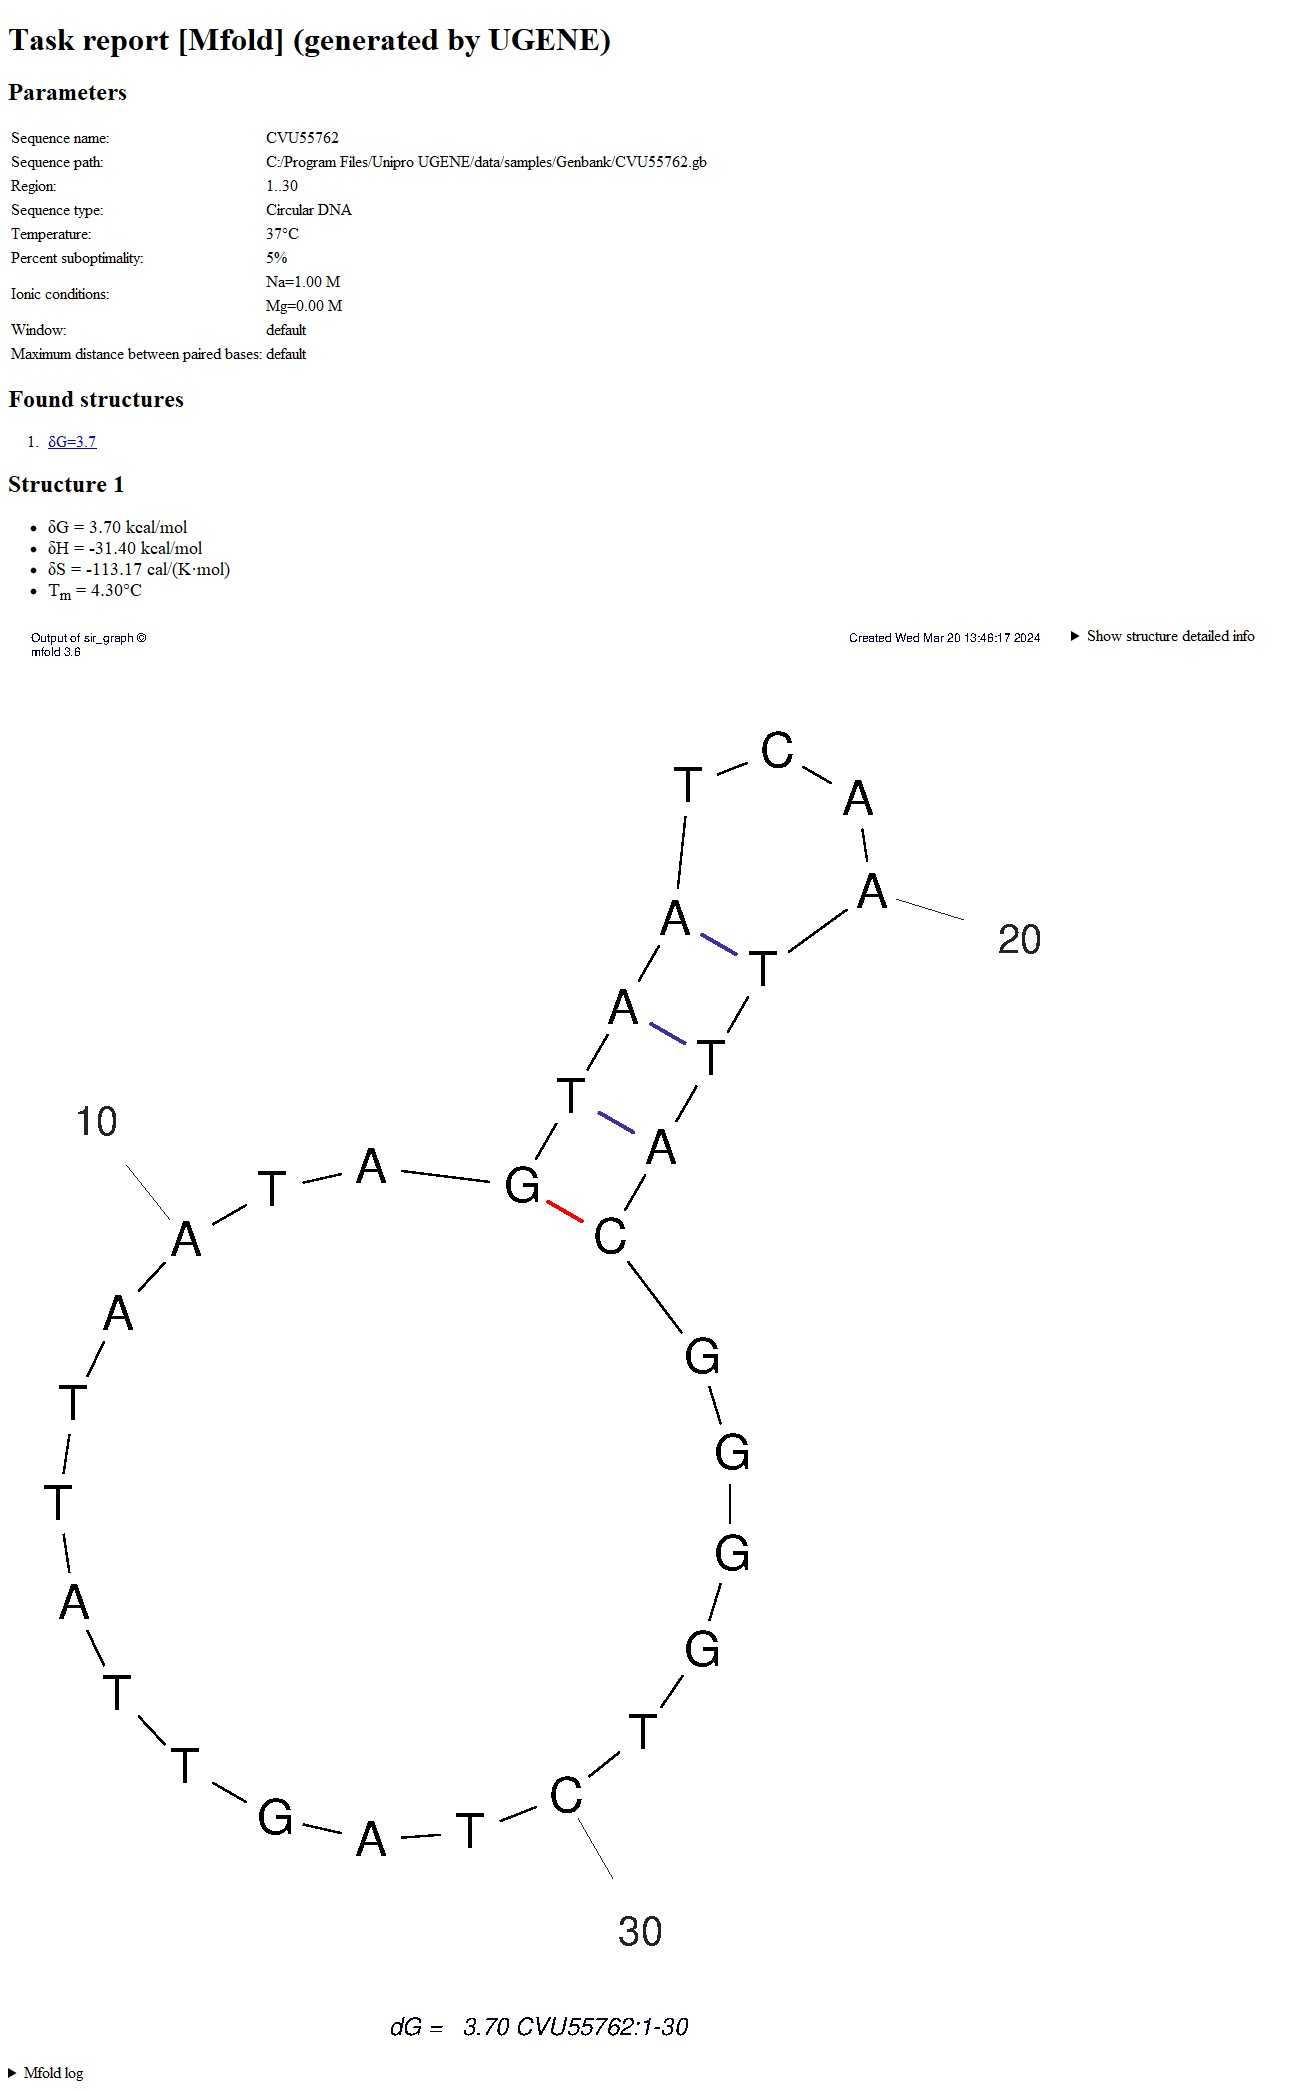 This version of the report also contains:
- Launch information.
- List of found structures with links to them.
- Information about each structure. The Loop Free-Energy Decomposition is located under the "Show structure detailed info" arrow.
The quality of the images in the report depends on the DPI setting in the dialog. When you click on the picture, a PDF file with a structure image opens in a new tab, identical to the picture image, but allows you to zoom without losing quality.
More details are described in the Structure table subsection of the UGENE report section. - mfold log.
This report is portable, i.e., if the directory is completely copied (HTML+all PNGs+all PDFs), the copied data can be re-opened in the browser without loss of functionality. Folders can be deleted/renamed; it will not affect the operation of UGENE.
Temporary output
For advanced users.
mfold produces many files. Not all of them are displayed in the reports. However, while the current UGENE session is open, you can see what other files mfold produces.
In the Log corresponding to the [Algorithms][DETAILS] subcategories, you can see the mfold launch command. It depends on where the UGENE temporary directory is set. For example, it might look like this
"C:\Program Files\Unipro UGENE\tools\mfold\mfold.bat" SEQ=C:\tmp\ugene_tmp\p14120\mfold\d_0\inp.fa RUN_TYPE=html NA=DNA LC=circular T=37 P=5 NA_CONC=1 MG_CONC=0 MAX=100 ROT_ANG=0
In this case, all temporary output files will be located in C:\tmp\ugene_tmp\p14120\mfold\d_0. For information about the purpose and format of this data, please read the article.
Tool comparison
As mentioned earlier, the mfold tool can also be launched from the native site or from the IDT platform.
| UGENE | unafold.org | OligoAnalyzer | |
|---|---|---|---|
| Internet connection | not required | must be (http connection) | must be |
| Privacy | share only what you want | results are visible to everyone | results are visible only to you |
| Storing results | stored as long as needed | are removed over time | stored while the session is open (30 minutes) |
| File output completeness | no energy dot plot | there are all files including energy dot plot | there is energy dot plot but not some other side files |
| Image quality | vector format is represented by PDF files quality of raster images (PNG) is configurable | vector format is represented by PDF and PS files quality of raster images (PNG, JPEG) is configurable | no vector format raster images aren't configurable |
| Completeness of algorithm settings | some settings for RNA aren't taken into account no constraints | all constraints can be specified | truncated part no constraints, have their own settings |
| Completeness of display settings | impossible to specify region's offset relative to original sequence | offset setting | no offset |
| Max sequence length | 3000 | 2400 | 255 |
https://en.wikipedia.org/wiki/List_of_RNA_structure_prediction_software
References
- Article https://www.ncbi.nlm.nih.gov/pmc/articles/PMC169194/
- mfold home http://www.unafold.org/
- mfold DNA prediction http://www.unafold.org/mfold/applications/dna-folding-form.php
- mfold RNA prediction http://www.unafold.org/mfold/applications/rna-folding-form.php
- mfold sources http://www.unafold.org/mfold/software/download-mfold.php
- mfold settings documentation http://www.unafold.org/mfold/documentation/mfold-documentation.php
- Viewing launch results http://www.unafold.org/cgi-bin/view-folds.cgi
- Forum with mfold authors http://www.unafold.org/forum/
- mfold references http://www.unafold.org/mfold/documentation/mfold-references.php
- Implementation of mfold by IDT company (OligoAnalyzer) https://www.idtdna.com/calc/analyzer