...
If several regions have been selected in a sequence (using the GenBank format), then the dialog will only accept the first of them. The remaining selected regions are ignored. But there is an exception: if the sequence is marked circular and the region passing through the end/beginning is selected, then such a region is considered as a whole region and mfold will be launched on it as on an ordinary piece of the sequence (2 parts of the region – one that goes to end and another that starts from the beginning of the sequence – will be combined into one sequence and analyzed). This is the only case where the start of a region can be greater than the end:
| Anchor | ||||
|---|---|---|---|---|
|
The length of the region in this case 70..50 depends on the sequence length.
Output settings
UGENE&Ghostscript settings in the "Output" tab.
| Parameter | Default | Description | ||||
|---|---|---|---|---|---|---|
| Save output to | /path/to/sequence/ | The folder where the "mfold" subdirectory will be created with the output data in it. By default, this folder is the same as the folder where the input sequence is stored. For example, let's say our OS is Windows and the analyzed sequence has the path "C:\path\to\sequence\my_sequence.fa". After running the task, the folder structure will look something like this
| ||||
| DPI | 96 | Setting up the Ghostscript converter from ps files to PNG. Quality of saved images (PNG files). The higher this parameter, the higher the quality, size and resolution of the resulting images.
|
...
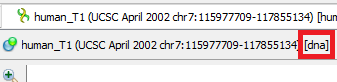
- Molecule Type (DNA/RNA). mfold gets sequence information from command line arguments. Information about what type will be passed to the tool can be seen next to the sequence name
- Molecule Topology (linear/circular). mfold gets sequence information from command line arguments. If the sequence is marked as circular, then mfold will work with it as a circular one. Otherwise, as with linear one.
In Whether the picture below, the sequence human_T1 is linear and therefore marked with the symbol , and CVU55762 with
  is circular.
/circular is described here.
Part of a circular sequence will also be considered a circular sequence. If you want to change this behavior, uncheck "Mark sequence as circular" and then call the mfold dialog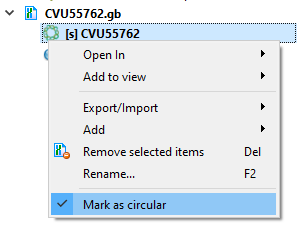
- DPI of images in UGENE. Ghostscript has a default DPI of 72. Therefore, this value is used for images for the internal UGENE report and this value cannot be changed.
Output data
There are 3 types of output from the mfold task in UGENE:
- Report displayed inside UGENE.
- HTML report with images saved on disk.
- Temporary data (for advanced users).
UGENE report
Example of a report on Windows (appearance may vary slightly between systems):
- Status, Time, … At the beginning there is information about the run: information about the task, settings for launch.
- Output HTML report. Clickable link to the output HTML report. More about this report in the next section.
- Found structures. List of found structures. The structure is characterized by free energy. When clicked, UGENE will scroll the window to the desired structure.
- Structure table. The table contains
- Thermodynamic details: free energy, enthalpy, entropy and an estimated Tm.
- Loop Free-Energy Decomposition: the entire decomposition of the particular folding into loops and stacks, together with their free energies and closing base pairs. Consecutive runs of base pairs are summarized as helices.
- Image. Displays of nucleic acid secondary structure. At the bottom of the image there is information identifying it: free energy, name of the input sequence and region of analysis.
- mfold log. Information about launching the external mfold tool: launch command and log.
| Info |
|---|
If no structure is found, mfold will fail with an error and display a corresponding message "No hairpins found. Nothing to show". No new files will be created. |
| Info |
|---|
Sometimes the report may not contain the structure table. This happens because there are a lot of results/the resulting decomposition tables are too large. In this case, the result must be viewed in a browser (click on the "Output HTML report" link). |
HTML report
A single HTML report and PNG+PDF for each structure found are saved in the output folder. The HTML report displays these images, PDFs and detailed information about the launch in an easy-to-view form.
Tool comparison
хранение результатов
...